State Growth Tasmania
Workers place of residence by occupation - All occupations
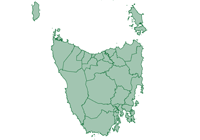
Journey to Work (workers) data shows where State Growth Tasmania's local workers come from and how far they are travelling to access employment in the area.
This shows the degree to which the local economy draws on the wider region to supply labour for its industries. It is also useful in planning and advocacy for roads and public transport provision.
The distance and direction travelled by workers in different broad occupations is generally influenced by a few factors. These primarily include the type and skill level of jobs located within the local area, and the residential location where those skills are available in the population. The pay level of particular occupations is also a factor, as people will travel further for a high-paying job.
Understanding how far people travel to access particular occupation categories in the area can help in developing programs for equity in the jobs market, and having affordable housing available for workers of all skill levels.
Workers place of residence data should be viewed alongside Self-sufficiency and Jobs to workers ratio datasets for a summary of local employment opportunity by industry, as well as modelled Employment by industry (Total) numbers and Employment locations to understand the relative size of each industry sector and its distribution across State Growth Tasmania. To analyse the characteristics of local workers in each industry, go to the Local workers section.
Data source
Australian Bureau of Statistics (ABS) – Census 2021 – by journey to work
Occupation
| Residential location of local workers by occupation | |||||||||
|---|---|---|---|---|---|---|---|---|---|
| State Growth Tasmania - All occupations | 2021 | ||||||||
| Location | Number | % | |||||||
| Live and work in the area | 238,350 | 99.4 | |||||||
| - Live and work in the same LGA | 126,690 | 52.8 | |||||||
| - Work in the area and live in different LGA | 111,660 | 46.6 | |||||||
| Work in the area, but live outside | 1,377 | 0.6 | |||||||
| Total workers in the area | 239,727 | 100.0 | |||||||
Source: Australian Bureau of Statistics, Census of Population and Housing 2021. Compiled and presented in economy.id by .id (informed decisions) | |||||||||

| Residential location of local workers by LGA by occupation | |||||||||
|---|---|---|---|---|---|---|---|---|---|
| State Growth Tasmania - All occupations | 2021 | ||||||||
| Location | Number | % | |||||||
| Launceston | 30,616 | 12.8 | |||||||
| Clarence | 27,277 | 11.4 | |||||||
| Hobart | 27,115 | 11.3 | |||||||
| Glenorchy | 22,432 | 9.4 | |||||||
| Kingborough | 18,197 | 7.6 | |||||||
| West Tamar | 10,758 | 4.5 | |||||||
| Devonport | 10,502 | 4.4 | |||||||
| Central Coast (Tas.) | 9,372 | 3.9 | |||||||
| Meander Valley | 8,997 | 3.8 | |||||||
| Burnie | 8,286 | 3.5 | |||||||
| Brighton | 7,761 | 3.2 | |||||||
| Sorell | 7,229 | 3.0 | |||||||
| Huon Valley | 6,969 | 2.9 | |||||||
| Northern Midlands | 5,887 | 2.5 | |||||||
| Waratah-Wynyard | 5,468 | 2.3 | |||||||
| Latrobe (Tas.) | 5,090 | 2.1 | |||||||
| Derwent Valley | 4,296 | 1.8 | |||||||
| Circular Head | 3,450 | 1.4 | |||||||
| Southern Midlands | 2,761 | 1.2 | |||||||
| Dorset | 2,621 | 1.1 | |||||||
| Kentish | 2,588 | 1.1 | |||||||
| George Town | 2,333 | 1.0 | |||||||
| Break O'Day | 2,071 | 0.9 | |||||||
| Glamorgan-Spring Bay | 1,882 | 0.8 | |||||||
| West Coast | 1,505 | 0.6 | |||||||
| Central Highlands (Tas.) | 865 | 0.4 | |||||||
| Tasman | 838 | 0.3 | |||||||
| King Island | 760 | 0.3 | |||||||
| Flinders (Tas.) | 424 | 0.2 | |||||||
| No usual address (Tas.) | 227 | 0.1 | |||||||
| Brisbane | 102 | 0.0 | |||||||
| Melbourne | 43 | 0.0 | |||||||
| Unincorporated ACT | 39 | 0.0 | |||||||
| Gold Coast | 38 | 0.0 | |||||||
| Moreton Bay | 33 | 0.0 | |||||||
| Greater Geelong | 31 | 0.0 | |||||||
| Boroondara | 26 | 0.0 | |||||||
| Yarra | 26 | 0.0 | |||||||
| Stonnington | 23 | 0.0 | |||||||
| Mornington Peninsula | 23 | 0.0 | |||||||
| Merri-bek | 22 | 0.0 | |||||||
| Port Phillip | 21 | 0.0 | |||||||
| Wyndham | 21 | 0.0 | |||||||
| Townsville | 20 | 0.0 | |||||||
| Sunshine Coast | 19 | 0.0 | |||||||
| Parramatta | 19 | 0.0 | |||||||
| Cairns | 17 | 0.0 | |||||||
| Yarra Ranges | 17 | 0.0 | |||||||
| Whitehorse | 15 | 0.0 | |||||||
| Bayside (Vic.) | 15 | 0.0 | |||||||
| Maribyrnong | 15 | 0.0 | |||||||
| Moonee Valley | 14 | 0.0 | |||||||
| Stirling | 14 | 0.0 | |||||||
| Whittlesea | 13 | 0.0 | |||||||
| Glen Eira | 13 | 0.0 | |||||||
| Ballarat | 13 | 0.0 | |||||||
| Sydney | 12 | 0.0 | |||||||
| Ku-ring-gai | 12 | 0.0 | |||||||
| Lake Macquarie | 12 | 0.0 | |||||||
| Darebin | 11 | 0.0 | |||||||
| Nillumbik | 11 | 0.0 | |||||||
| Monash | 10 | 0.0 | |||||||
| Newcastle | 10 | 0.0 | |||||||
| Northern Beaches | 10 | 0.0 | |||||||
Source: Australian Bureau of Statistics, Census of Population and Housing 2021. Compiled and presented in economy.id by .id (informed decisions) Excludes residential locations with fewer than 10 people. | |||||||||